· 2 min read
The Prometheus Cheatsheet
The monitoring and time series database
What is Prometheus?
Prometheus is a tool that collects metrics data exposed by different applications in a central place. These applications can be in different programming languages.
You can run queries against the data and get results that can be seen or plotted on visualization tools like Graphana.
How does Prometheus work?
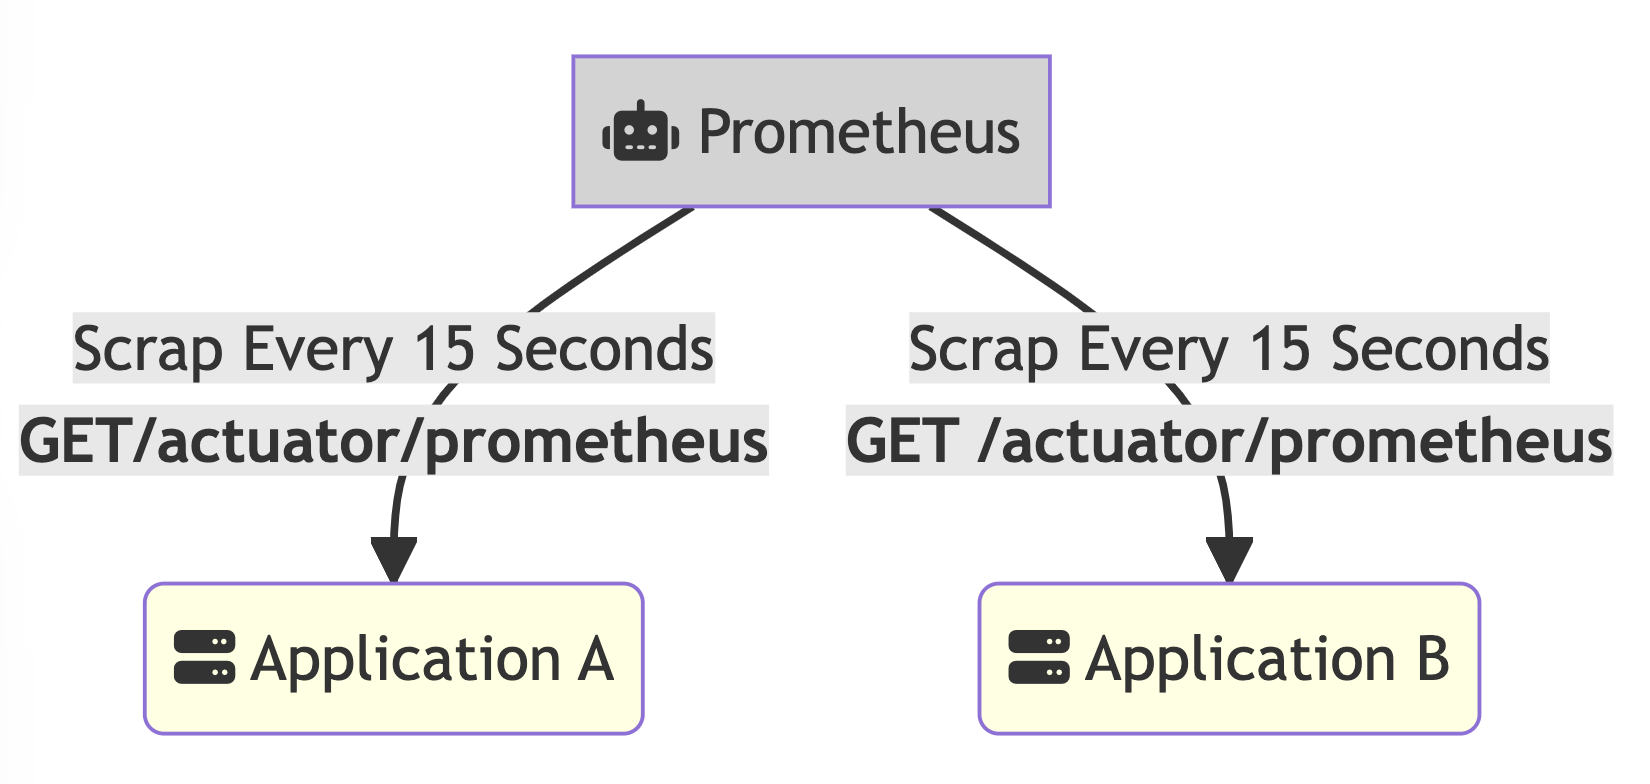
Prometheus server polls every application configured every few seconds. The number of seconds can be changed.
How do you set up an application to give out Prometheus metrics?
Prometheus has many first-hand plugins for languages like Java, Python and Javascript. And has an ecosystem of third-party plugins for other languages like .NET.
Many tools also generate responses in Prometheus format. For example:
- WilfFly, which is an old JBOSS server thingy (I’m gen Z), can generate data in Prometheus format.
- Spring Boot Actuators also have an endpoint
GET /actuator/prometheusthat can be used for getting the same data.
Every application exposing prometheus data requires a prometheus.yml file which describes what’s the fetch interval and other details.
How do you add custom metrics in Prometheus?
There are tools like Micrometer that you can use to add custom metrics and then expose those metrics in Prometheus format to Prometheus.
Reading: Spring Metrics Prometheus
How do you run Prometheus queries with PromQL?
PromQL is the query language used to run queries on Prometheus.
How do you visualize responses to queries?
Can be done in graphana or any other visualization tool
Resources
Prometheus Graphana YouTube Series